Your boutique residential real estate consultancy and brokerage specializing in Boston’s most highly sought addresses.


SALES ANALYSIS: $1.6M to $2.4M IN BACK BAY & BEACON HILL
BY Jeff Hamilton |
December 6, 2019
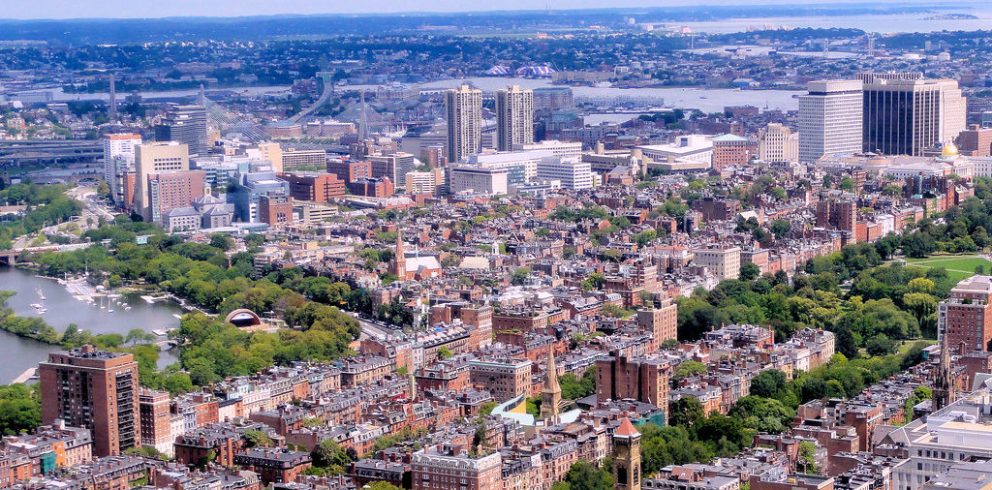
As some of the oldest and most charming neighborhoods in america, there has always been a draw to Boston’s Back Bay and Beacon Hill. With immediate access or views of the Boston Public Garden, the Charles River, and the city skylines, this is an area that demands one put their money where their mouth is if they want to live in these luxury residential streets.
Let’s dive into some sales that have occurred in the last 12 months in these sought after neighborhoods. The following 52 transactions were priced between $1.6M and $2.4M. They sold at an average price per foot of $1,266.36. For context, in 2018, there were 61 sales with average pricing of $1,279/SF in the same price range. All of these were “on market” sales. *
| $/SF | % asking achieved | DoM | |
| Average | $ 1,266.36 | 94.53% | 77.35 |
| Median | $ 1,248.13 | 95.54% |
*data sourced from MLS PIN on 12/6/19
Now we’ll break these sales down by our sub-neighborhoods, so you can get a first hand look at the data.
Back Bay
Lower Back Bay
Average $/SF: $ 1,277.60
| Date | Address | SF | $/SF | Sale Price | List Price | % Change | DoM | ||
| 11/13/2019 | 124 Beacon St PHR | 1583 | $ 1,099.18 | $ 1,740,000 | $ 1,840,000 | 95% | 26 | ||
| 9/30/2019 | 166 Beacon St 2 | 1849 | $ 1,133.04 | $ 2,095,000 | $ 2,350,000 | 89% | 210 | ||
| 6/26/2019 | 180 Beacon St 3F | 1396 | $ 1,253.58 | $ 1,750,000 | $ 1,795,000 | 97% | 246 | ||
| 7/8/2019 | 191 Beacon St 2 | 1580 | $ 1,329.11 | $ 2,100,000 | $ 2,449,000 | 86% | 85 | ||
| 4/24/2019 | 236 Beacon St 2E | 1245 | $ 1,465.86 | $ 1,825,000 | $ 1,695,000 | 108% | 20 | ||
| 10/21/2019 | 249 Beacon St 2 | 1952 | $ 981.05 | $ 1,915,000 | $ 2,490,000 | 77% | 135 | ||
| 7/31/2019 | 206 Beacon St 1 | 2007 | $ 916.79 | $ 1,840,000 | $ 2,199,000 | 84% | 101 | ||
| 5/14/2019 | 300 Boylston 909 | 1310 | $ 1,393.13 | $ 1,825,000 | $ 2,195,000 | 83% | 183 | ||
| 10/22/2019 | 1 Charles St S 806 | 1528 | $ 1,079.84 | $ 1,650,000 | $ 1,695,000 | 97% | 31 | ||
| 3/6/2019 | 1 Charles St S 14H | 1571 | $ 1,169.32 | $ 1,837,000 | $ 1,899,000 | 97% | 100 | ||
| 8/19/2019 | 1 Charles St S 4H | 1571 | $ 1,145.13 | $ 1,799,000 | $ 1,799,000 | 100% | 147 | ||
| 11/12/2019 | 30 Commonwealth Ave 2 | 1892 | $ 1,188.69 | $ 2,249,000 | $ 2,349,000 | 96% | 231 | ||
| 6/28/2019 | 113 Commonwealth Ave 3 | 1860 | $ 1,230.11 | $ 2,288,000 | $ 2,325,000 | 98% | 21 | ||
| 5/22/2019 | 321 Dartmouth St 2 | 1410 | $ 1,560.28 | $ 2,200,000 | $ 1,995,000 | 110% | 17 | ||
| 4/30/2019 | 11 Exeter St 4 | 1145 | $ 1,397.38 | $ 1,600,000 | $ 1,749,000 | 91% | 104 | ||
| 12/14/2018 | 1 Huntington Ave 804 | 1220 | $ 1,438.52 | $ 1,755,000 | $ 1,850,000 | 95% | 27 | ||
| 7/19/2019 | 1 Marlborough St 4 | 1225 | $ 1,591.84 | $ 1,950,000 | $ 1,950,000 | 100% | 5 | ||
| 3/25/2019 | 17 Marlborough St 3 | 1135 | $ 1,506.61 | $ 1,710,000 | $ 1,699,000 | 101% | 13 | ||
| 7/26/2019 | 73 Marlborough St 6 | 2078 | $ 1,111.65 | $ 2,310,000 | $ 2,395,000 | 96% | 28 | ||
| 2/21/2019 | 400 Stuart St 24C | 1134 | $ 1,560.85 | $ 1,770,000 | $ 1,875,000 | 94% | 29 | ||
Upper Back Bay
Average $/SF: $ 1,253.58
| Date | Address | SF | $/SF | Sale Price | List Price | % Change | DoM | ||
| 7/18/2019 | 391 Beacon St 1 | 1830 | $ 1,065.57 | $ 1,950,000 | $ 2,150,000 | 91% | 88 | ||
| 6/12/2019 | 274 Beacon St 8 R | 1890 | $ 1,084.13 | $ 2,049,000 | $ 2,449,000 | 84% | 197 | ||
| 5/31/2019 | 285 Beacon St 6A | 1087 | $ 1,747.93 | $ 1,900,000 | $ 1,995,000 | 95% | 18 | ||
| 7/17/2019 | 448 Beacon St 1 | 1288 | $ 1,281.06 | $ 1,650,000 | $ 1,750,000 | 94% | 14 | ||
| 4/16/2019 | 280 Beacon St 41 | 1530 | $ 1,143.79 | $ 1,750,000 | $ 1,799,000 | 97% | 25 | ||
| 7/15/2019 | 369 Beacon St 1 | 1797 | $ 1,140.79 | $ 2,050,000 | $ 2,049,000 | 100% | 9 | ||
| 12/20/2018 | 383 Beacon St C | 1873 | $ 1,107.85 | $ 2,075,000 | $ 2,195,000 | 95% | 67 | ||
| 4/9/2019 | 250 Commonwealth Ave 14 | 1879 | $ 1,242.68 | $ 2,335,000 | $ 2,260,000 | 103% | 14 | ||
| 1/15/2019 | 255 Commonwealth Ave 3 | 1671 | $ 1,178.93 | $ 1,970,000 | $ 2,150,000 | 92% | 23 | ||
| 5/1/2019 | 296 Commonwealth Ave 5 | 1491 | $ 1,287.73 | $ 1,920,000 | $ 1,950,000 | 98% | 16 | ||
| 9/9/2019 | 327 Commonwealth Ave 3 | 1345 | $ 1,464.68 | $ 1,970,000 | $ 2,190,000 | 90% | 38 | ||
| 5/31/2019 | 375 Marlborough St 1 | 1543 | $ 1,296.18 | $ 2,000,000 | $ 2,050,000 | 98% | 28 | ||
| 12/12/2018 | 230 Marlborough St 3 | 1160 | $ 1,465.52 | $ 1,700,000 | $ 1,735,000 | 98% | 16 | ||
| 10/15/2019 | 375 Marlborough St 4 | 1380 | $ 1,557.97 | $ 2,150,000 | $ 2,300,000 | 93% | 84 | ||
| 8/15/2019 | 392 Marlborough St 2 | 1233 | $ 1,362.53 | $ 1,680,000 | $ 1,695,000 | 99% | 21 | ||
| 5/1/2019 | 360 Newbury St 807 | 2062 | $ 822.02 | $ 1,695,000 | $ 1,695,000 | 100% | 13 | ||
| 11/14/2019 | 360 Newbury St PH 809 | 1790 | $ 1,061.45 | $ 1,900,000 | $ 2,145,000 | 89% | 89 | ||
St. Botolph
Average $/SF: $ 1,209.35
| Date | Address | SF | $/SF | Sale Price | List Price | % Change | DoM | ||
| 12/3/2019 | 11 Durham St 5 | 1374 | $ 1,200.87 | $ 1,650,000 | $ 1,799,999 | 92% | 34 | ||
| 5/3/2019 | 67 Saint Botolph St 2 | 1400 | $ 1,225.00 | $ 1,715,000 | $ 1,799,000 | 95% | 323 | ||
| 3/1/2019 | 67 Saint Botolph St 3 | 1400 | $ 1,142.86 | $ 1,600,000 | $ 1,699,000 | 94% | 191 | ||
| 7/31/2019 | 67 St Botolph St P | 1675 | $ 1,268.66 | $ 2,125,000 | $ 2,199,000 | 97% | 38 | ||
Beacon Hill
Flat of the Hill
Average $/SF: $ 1,282.72
| Date | Address | SF | $/SF | Sale Price | List Price | % Change | DoM | ||
| 9/20/2019 | 95 Beacon St 11 | 1225 | $ 1,346.94 | $ 1,650,000 | $ 2,250,000 | 73% | 154 | ||
| 3/14/2019 | 87 Beacon St 2 | 1541 | $ 1,455.81 | $ 2,243,400 | $ 3,098,000 | 72% | 254 | ||
| 2/28/2019 | 10 Otis Place 4B | 2060 | $ 849.51 | $ 1,750,000 | $ 1,750,000 | 100% | 24 | ||
| 10/4/2019 | 145 Pinckney St 309 & 311 | 1285 | $ 1,478.60 | $ 1,900,000 | $ 1,649,999 | 115% | 3 | ||
Front Slope
Average $/SF: $ 1,393.51
| Date | Address | SF | $/SF | Sale Price | List Price | % Change | DoM | ||
| 8/30/2019 | 48 Beacon St 11R | 1302 | $ 1,267.28 | $ 1,650,000 | $ 1,650,000 | 100% | 28 | ||
| 7/22/2019 | 3 Beacon St 3 | 1348 | $ 1,361.28 | $ 1,835,000 | $ 1,950,000 | 94% | 182 | ||
| 7/9/2019 | 1 Chestnut St 2 A&B | 1720 | $ 1,235.47 | $ 2,125,000 | $ 2,125,000 | 100% | 41 | ||
| 8/5/2019 | 21 Walnut St M | 1038 | $ 1,710.02 | $ 1,775,000 | $ 1,775,000 | 100% | 8 | ||
North Slope
Average $/SF: $ 1,148.50
| Date | Address | SF | $/SF | Sale Price | List Price | % Change | DoM | ||
| 6/28/2019 | 123 Charles St 3 | 1931 | $ 1,014.63 | $ 1,959,250 | $ 1,950,000 | 100% | 11 | ||
| 9/3/2019 | 41-43 Phillips St 1 | 1739 | $ 1,293.85 | $ 2,250,000 | $ 2,595,000 | 87% | 92 | ||
| 8/15/2019 | 41-43 Phillips St 7 | 1759 | $ 1,137.01 | $ 2,000,000 | $ 2,348,000 | 85% | 120 | ||
Back Bay and Beacon Hill are home to some of Boston’s most sought after real estate and for good reason! Columbus & Over Group is your hyper-local expert in these core Boston neighborhoods. Let us know if we can help you find a way in or if we can introduce your home to its next lucky resident!